Written by: Andres Cuenca
![]()
Introduction
This post will introduce on how to build a PID (proportional, integral, derivative) simulator using MATLAB to generate step response graphs. This post requires to have a solid background in mechanical and electrical systems.
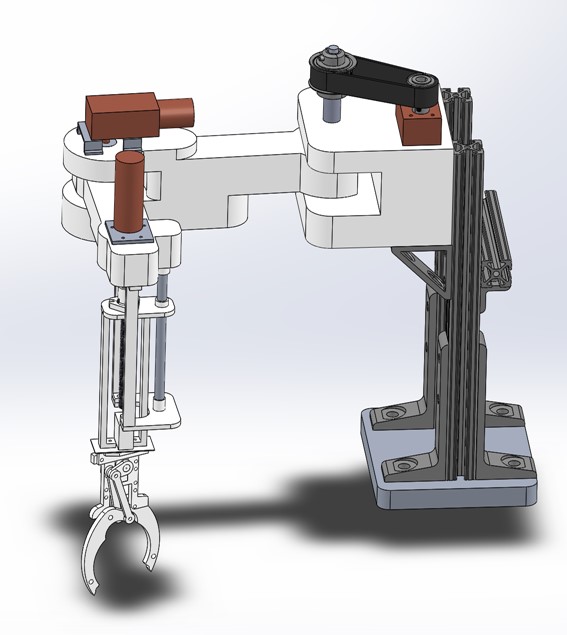
Suppose a robotic linkage is driven by a DC motor, a timing belt, and gears. The goal is for the DC motor to generate enough torque to rotate the robotic linkage to a desirable angular position of the robot. Using a DC motor integrated with a quadrature encoder and connected to an Arduino, it’s achievable to set up a PID controller code to program the shaft of the motor to rotate the robotic linkage to a specific position. However its require to tune the proportional, integral and derivative coefficients of the PID to achieve a smooth motion path for a robot that is driven by each DC motor. To understand how to achieve this goal, this MATLAB simulation program will properly tune each coefficient until the design criteria is met.
Design Criteria
- Zero Percent Overshoot
- Rise time < 1s
- Settling time < 1s
- Steady-State Error = 0
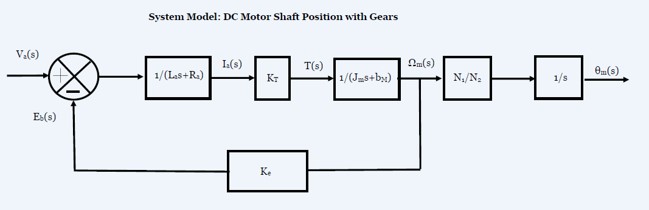
Deriving Plant System for Joint of Robot
For this simulation program the first joint of the SCARA robot functions on rotating the first linkage of the robot by applying a timing belt, gears and DC motor, as shown by the illustration below.
Therefore a plant system that represents the inertia load of the linkages are transpose to the shaft of DC motor. The following equation and coefficients have been analyzed and defined.
![]()
Control Loop System
The PID controller equation is the following.
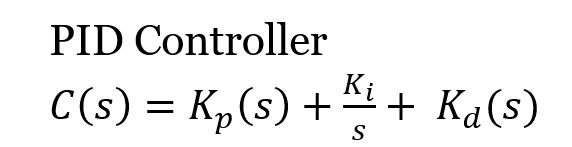
To meet the design criteria the proportional, integral and derivative coefficients will be properly tuned accordingly to the behavior of a step response graph that changes in respect to the PID controller and plant system equations.
Proportional
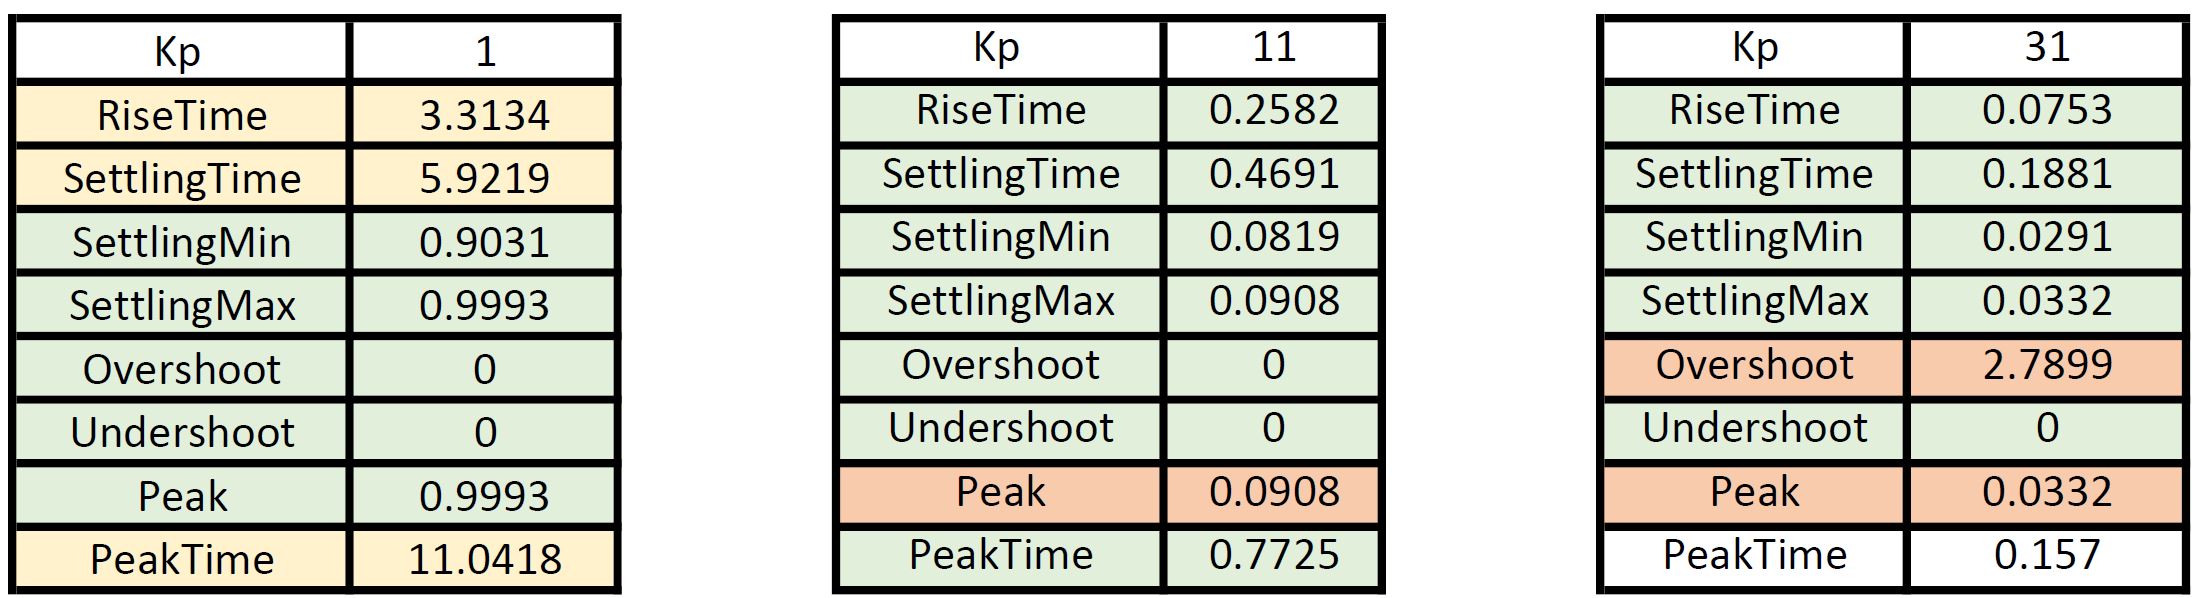
Following proportional step response graphs relative to various proportional gain values.
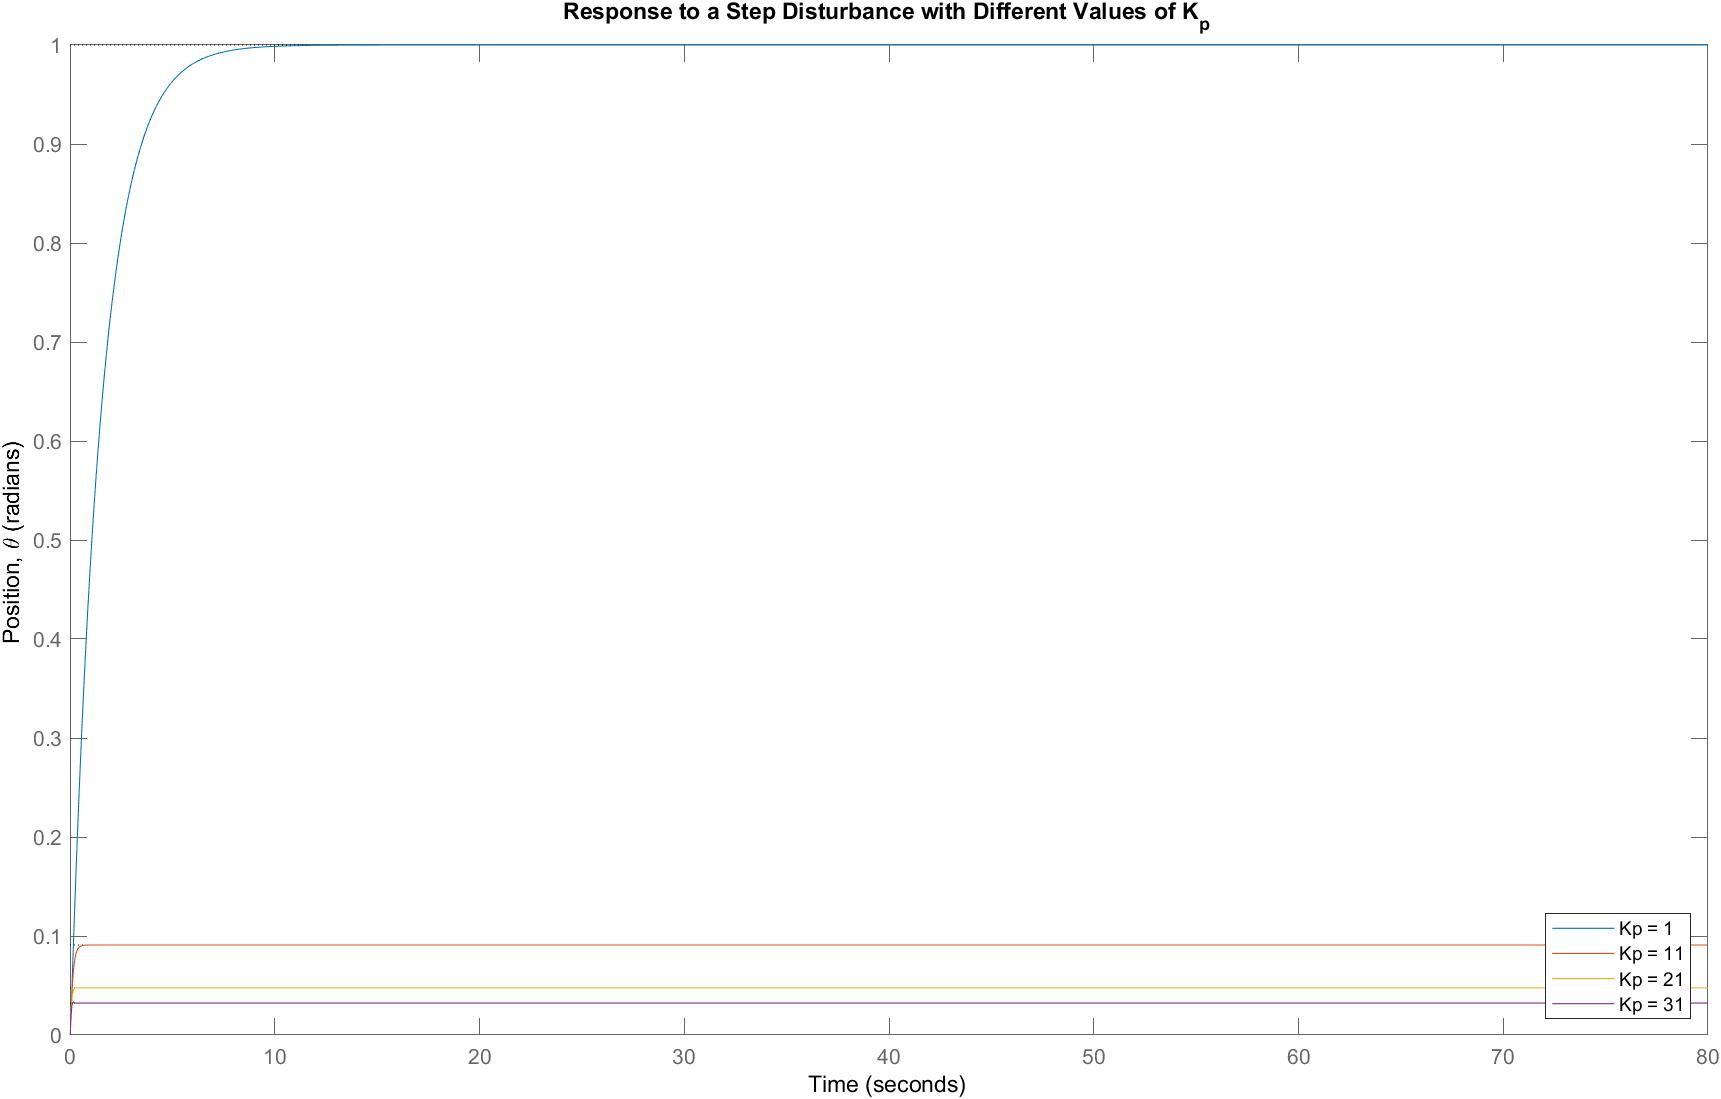
Characteristics of step response graphs in respect to Kp equal to 1, 11 and 31
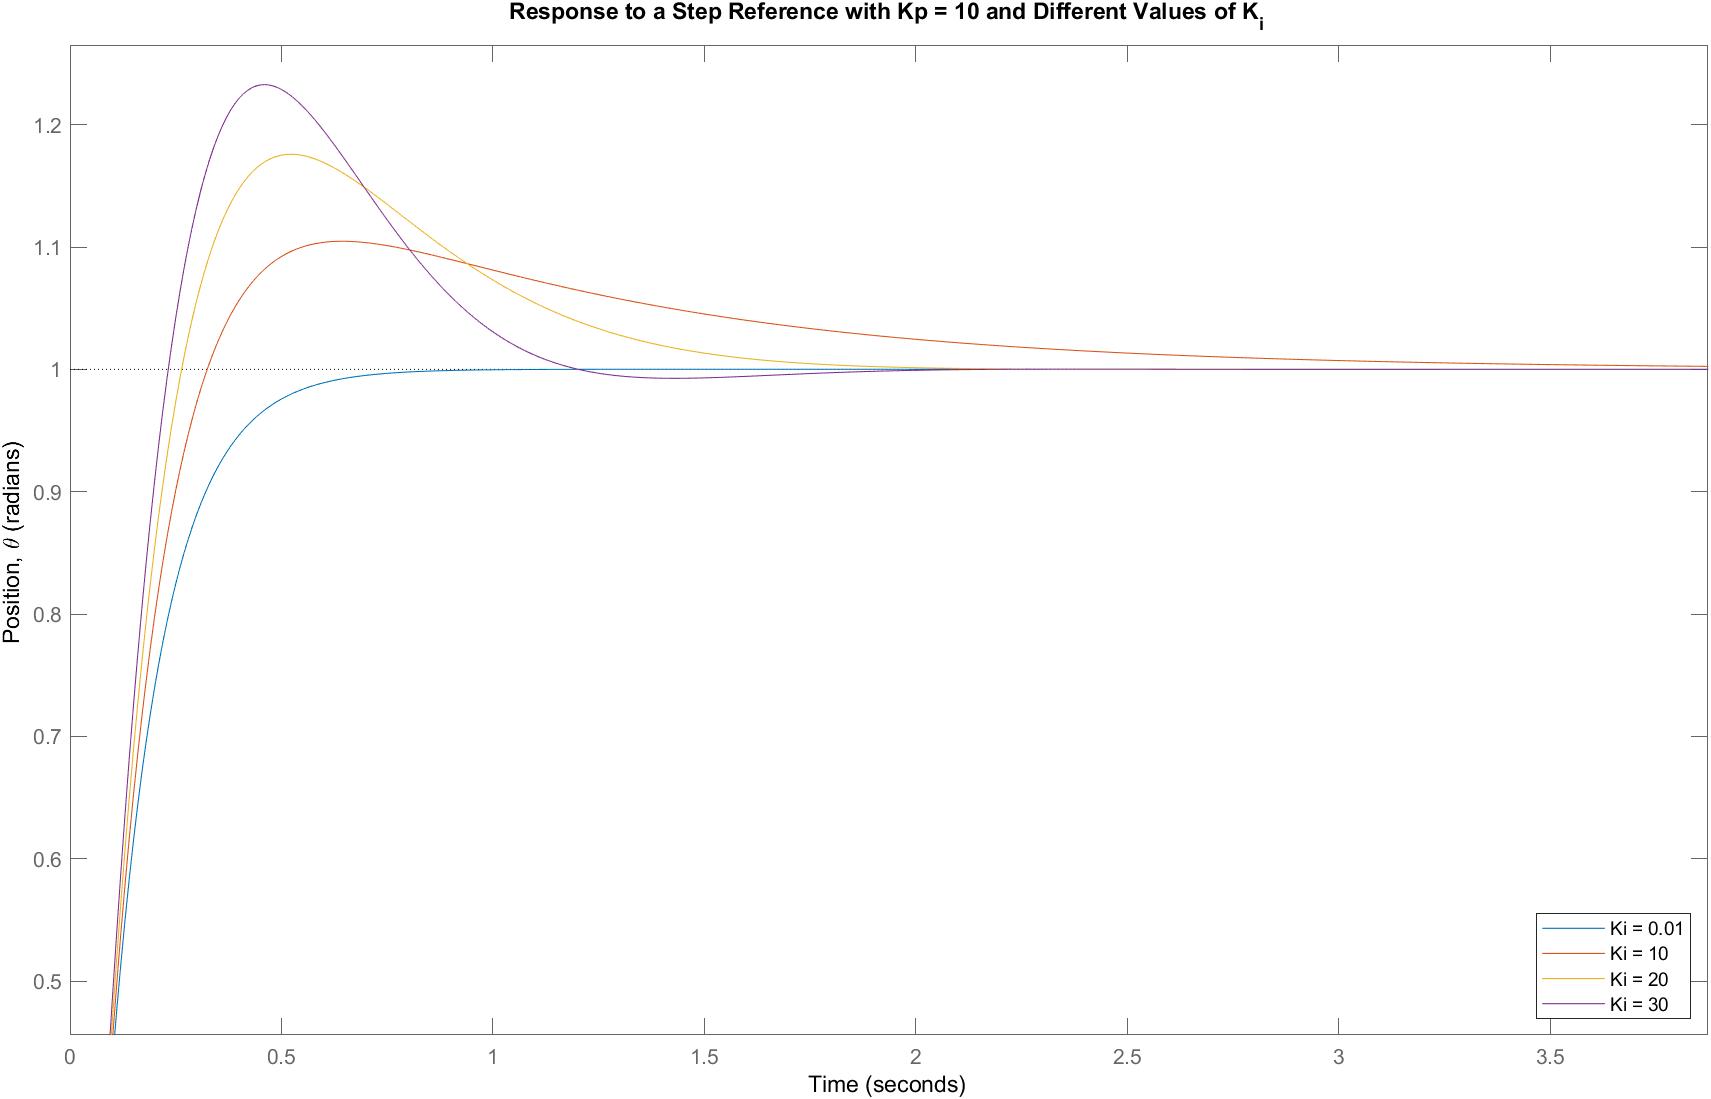
Proportional Integral
Step Response graphs of proportional gain equal to 10 and various integral coefficients
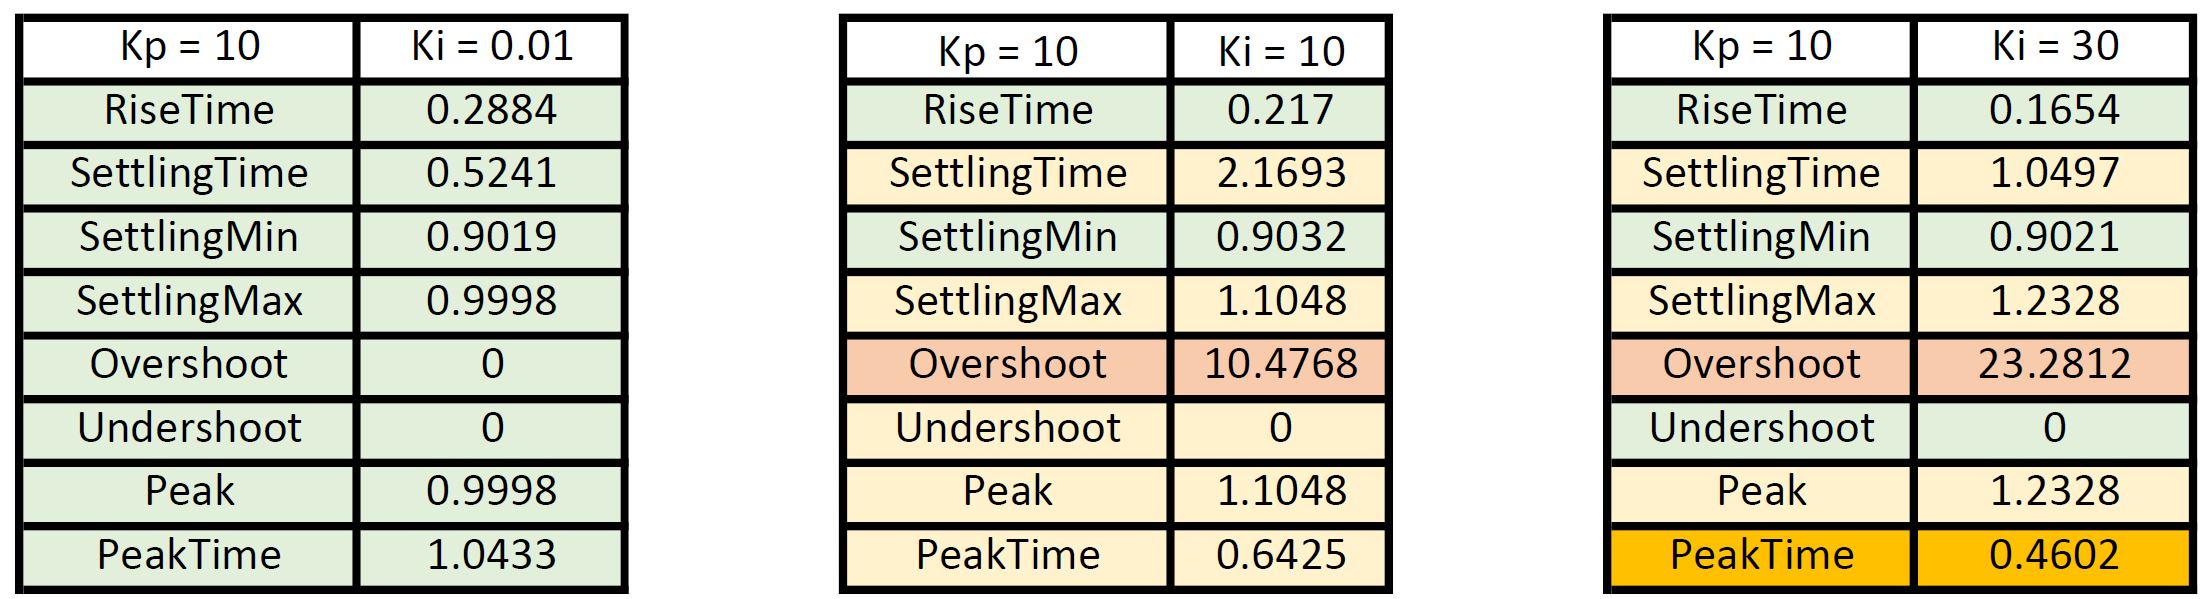
Characteristics of step response graphs in respect to Kp = 10, and Ki equal to 0.01, 10 and 30
Proportional Integral Derivative
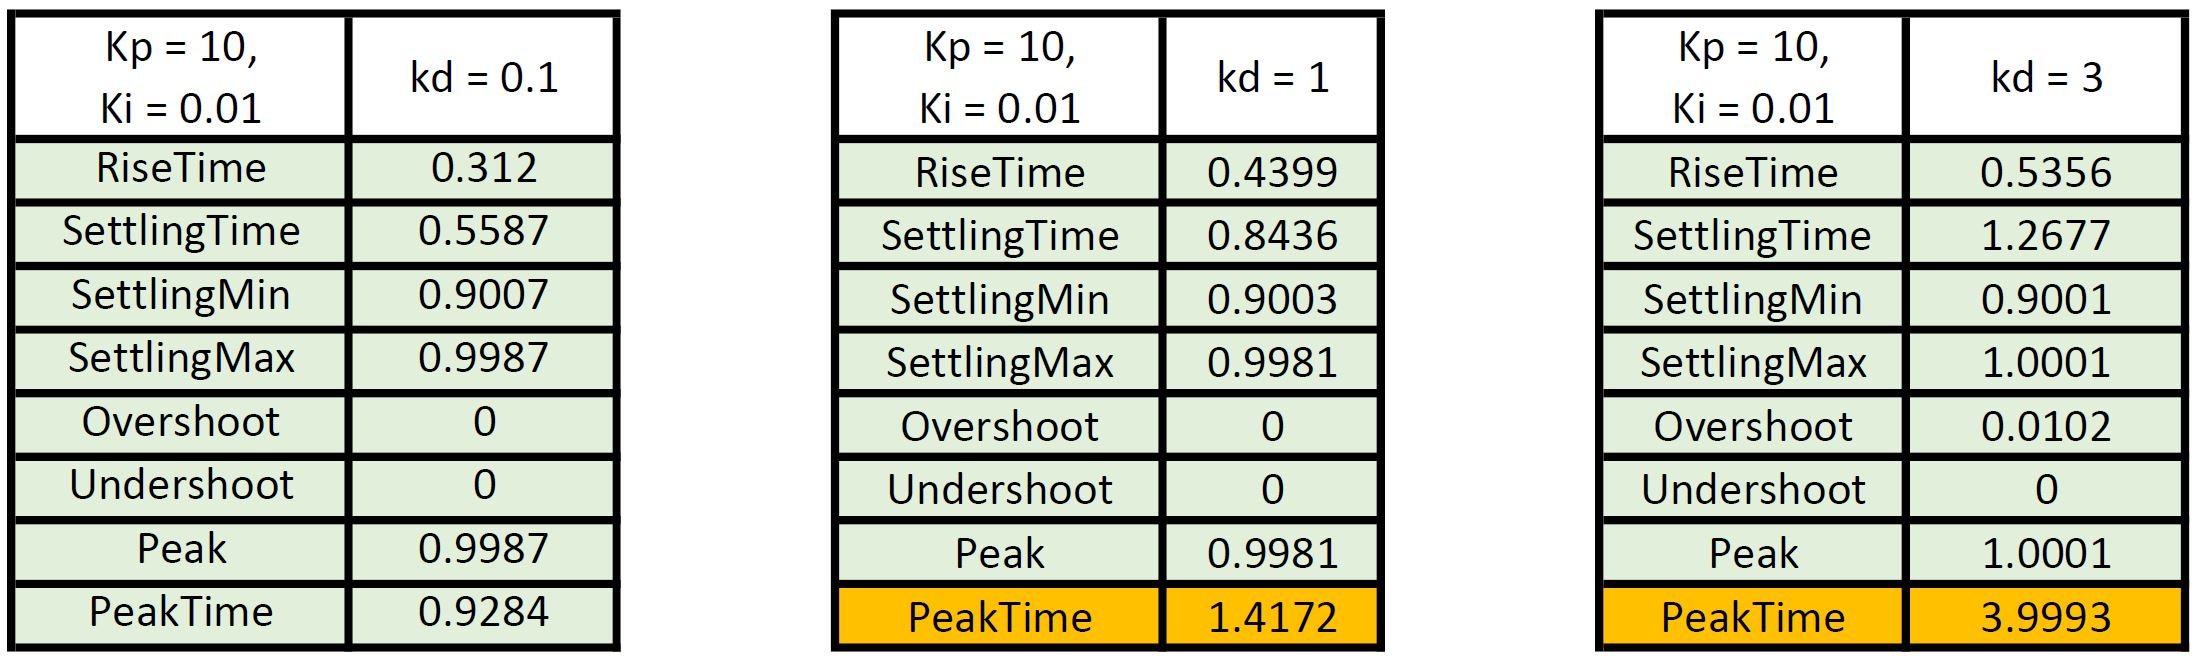
Step Response graphs of proportional gain equal to 10, Ki equal to 0.01 and various derivative coefficients
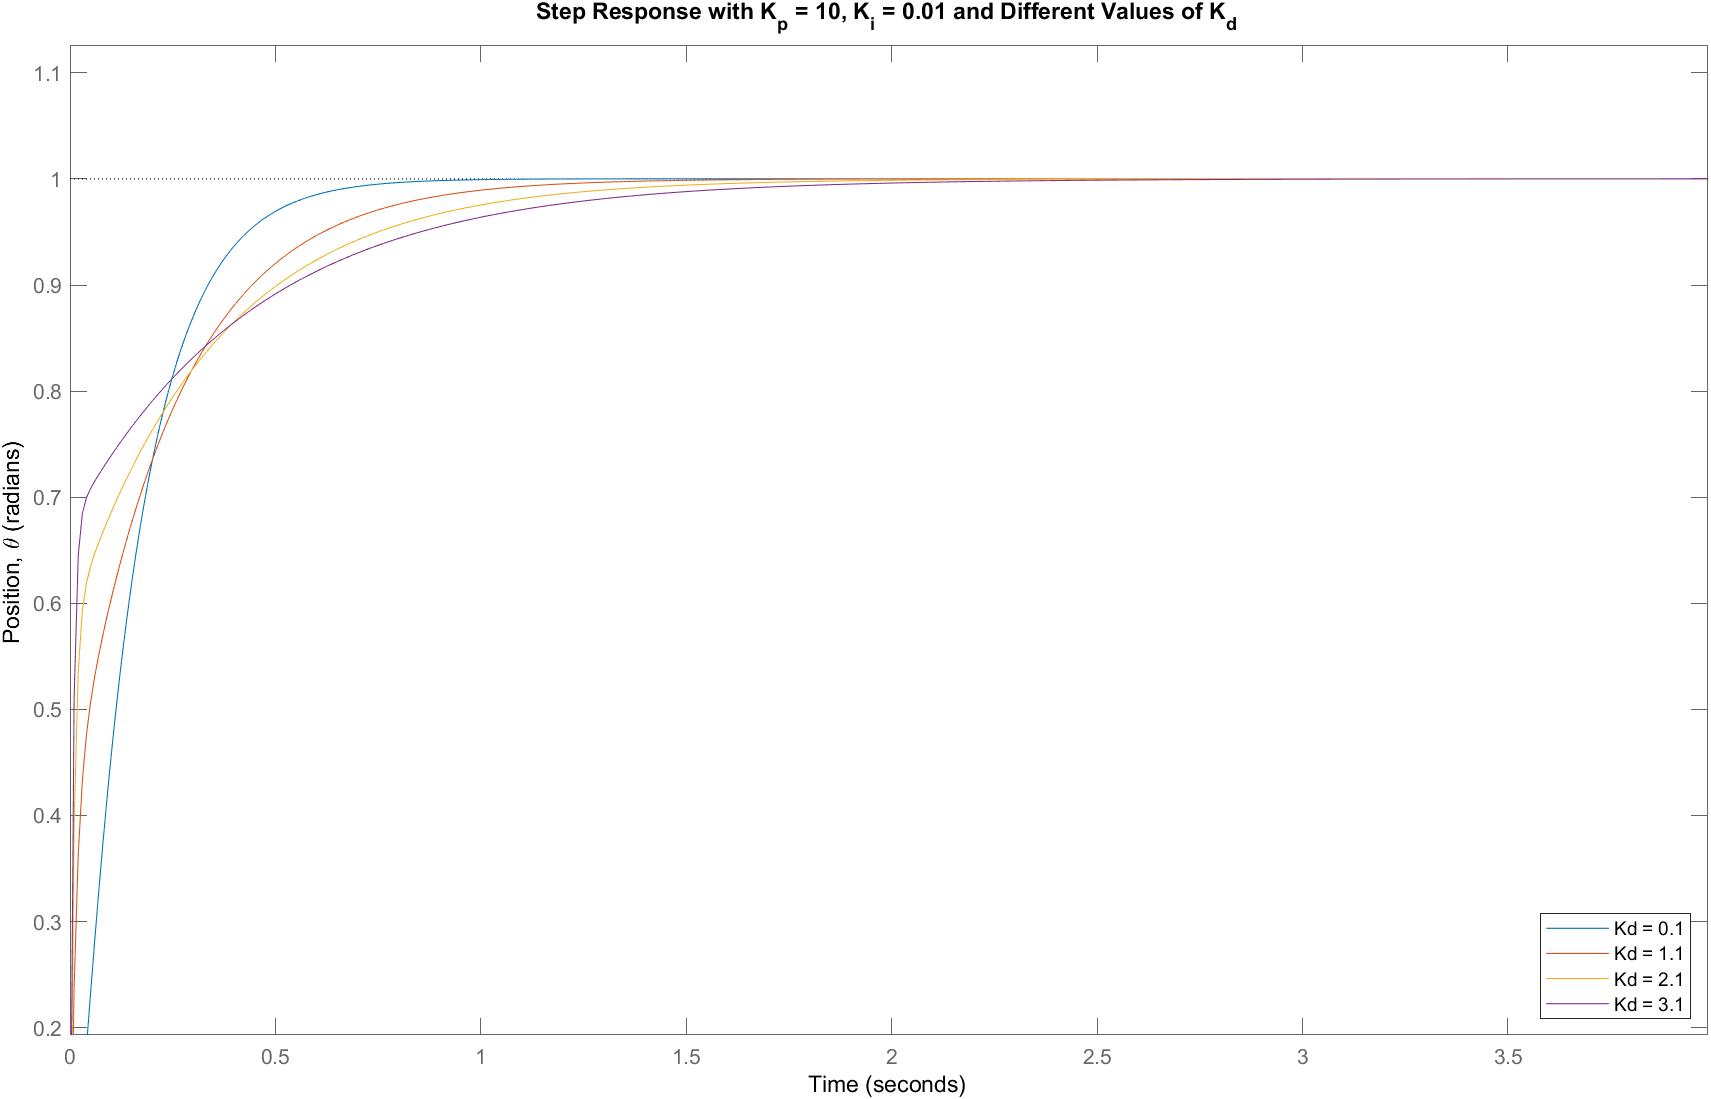
Characteristics of step response graphs in respect to Kp = 10, Ki = 0.01 and Kd = 0.1 , 1 and 3.
Next Steps
After successfully tuning the variables, then the next step is to test these coefficients on the actual hardware. Check out the Arduino PID Code to test and experiment.